Gross vs Net Retention
Gross vs Net Retention: What Every SaaS Leader Needs to Know
Written On
Riddhima Parkar
Posted On

Gross vs Net Retention: What Every SaaS Leader Needs to Know
Two numbers in most SaaS dashboards carry more weight than almost anything else: Gross Revenue Retention (GRR) and Net Revenue Retention (NRR). Together, they show whether existing customers are staying, shrinking, or growing.
Investors, boards, and finance teams read them like a report card.
Most SaaS teams track one or the other or mix up the formulas. Worse, some report a blended number that hides what's happening inside the customer base.
This guide breaks down gross vs. net revenue retention in plain language. It covers what each metric measures, how to calculate both, and what good looks like. It also shows how to use them to make smarter decisions about retention and growth.
What revenue retention measures
Revenue retention tracks how much recurring revenue a company keeps from its existing customers over a set period, usually a month or a year. It focuses entirely on the customers already in the book, not new logos.
In SaaS, that distinction matters. Recurring revenue from existing customers changes constantly. Some customers renew at the same rate, some upgrade, and some downgrade.
Some cancel. Revenue retention captures all of that movement and turns it into a single percentage.
GRR and NRR measure different sides of the same story:
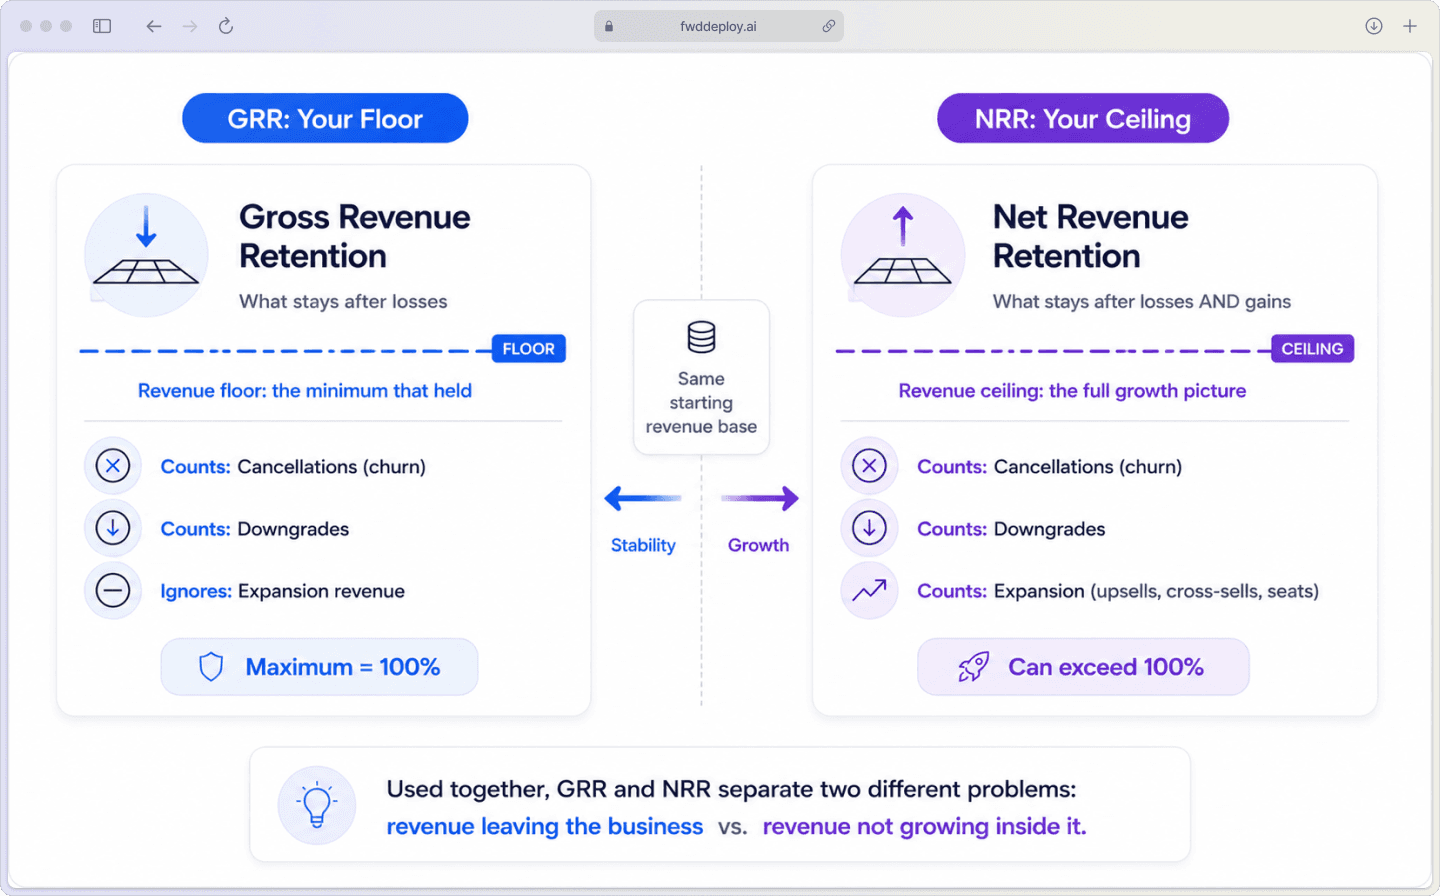
Gross Revenue Retention (GRR): How much recurring revenue stayed in place after losses from cancellations and downgrades, no expansion included
Net Revenue Retention (NRR): Recurring revenue retained plus growth from upsells, cross-sells, and add-ons
Think of GRR as your floor and NRR as your ceiling. GRR shows the revenue that held steady. NRR shows where that revenue ended up after the full picture, losses, and gains are counted.
Gross revenue retention explained
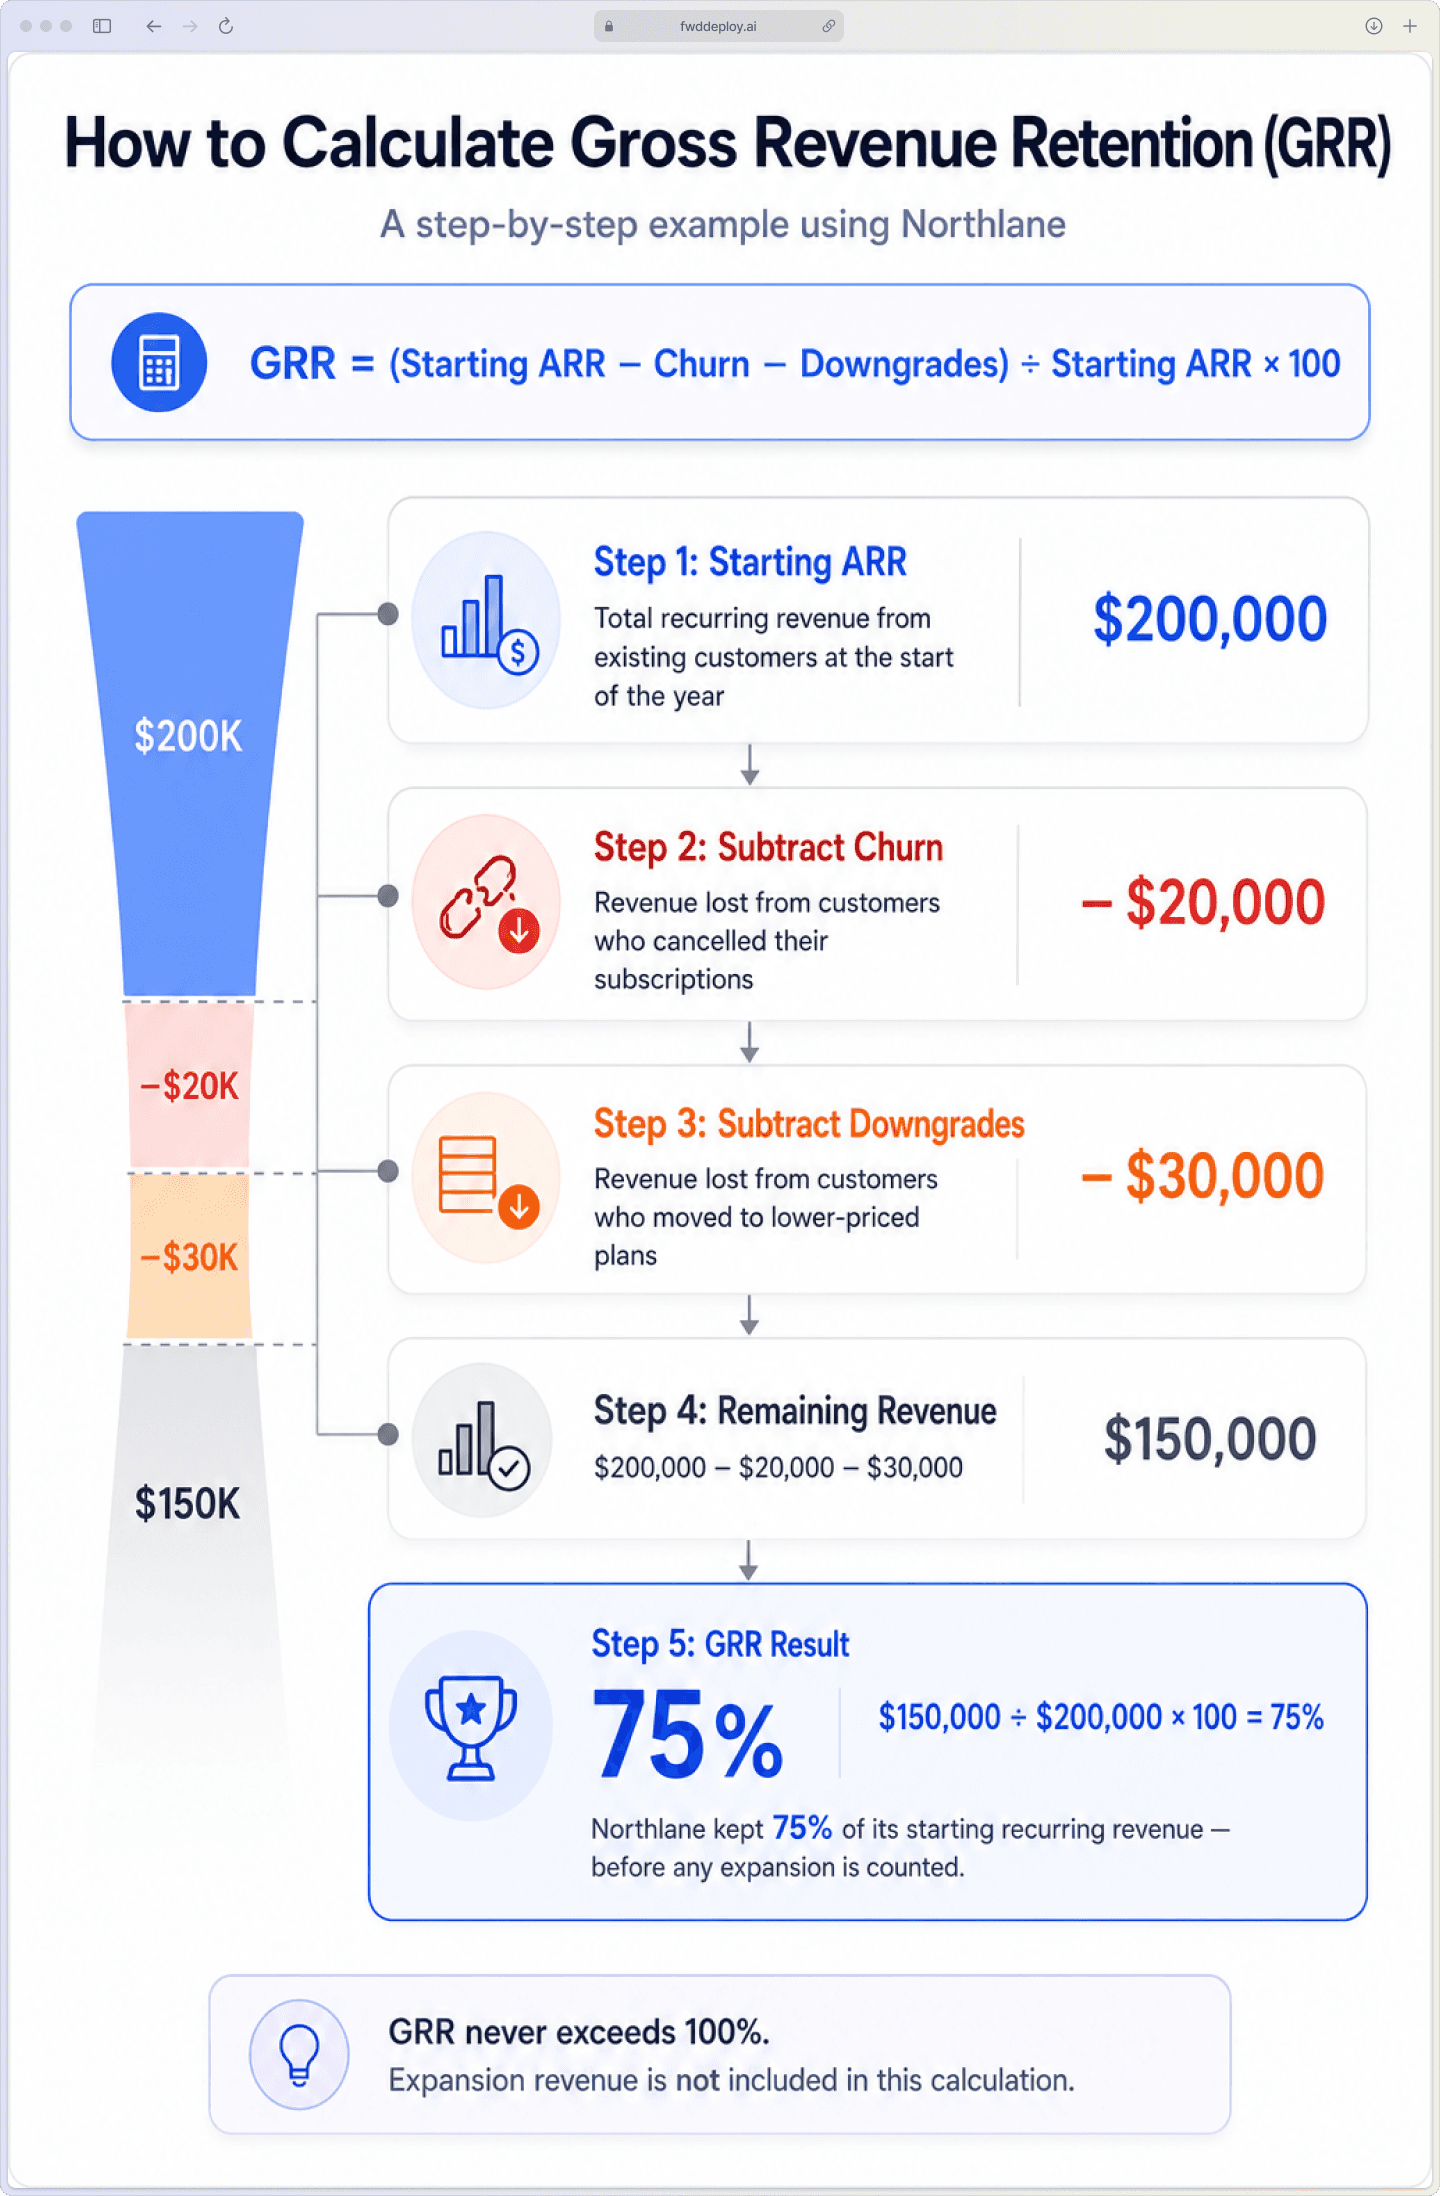
Gross Revenue Retention (GRR) is the percentage of recurring revenue kept from existing customers during a set period. It subtracts revenue lost to cancellations and downgrades.
GRR only looks at revenue that went down, not revenue that went up. If a customer cancels, that lost recurring revenue counts against GRR. If a customer moves to a lower-priced plan, that reduction also counts against GRR.
Upsells, cross-sells, and seat expansions are left out entirely.
Because expansion revenue is excluded, GRR can never exceed 100%. It is a pure measure of revenue durability, how much of the original recurring revenue base stayed intact.
What GRR includes: Starting ARR or MRR, minus revenue lost to cancellations and downgrades
What GRR excludes: Any new revenue from upsells, cross-sells, or seat expansion
What GRR signals: How well the core product retains value without relying on account growth to paper over losses
ARR = Annual Recurring Revenue.
MRR = Monthly Recurring Revenue
Both refer to the predictable, subscription-based revenue a SaaS company collects from active customers.
ARR by year, MRR by month.
Net revenue retention explained
Net Revenue Retention (NRR) is the percentage of recurring revenue kept from existing customers during a set period. It adds expansion revenue and subtracts losses from churn and downgrades.
NRR includes revenue from upgrades, added seats, cross-sells, and add-ons. Because of that, NRR can exceed 100%. This happens when expansion revenue from existing customers exceeds revenue lost from cancellations and downgrades.
What NRR includes: Starting revenue, plus expansion, minus churn and downgrades.
What NRR signals: Whether existing customers are spending more over time, not just staying.
Why NRR can exceed 100%: Expansion revenue can outpace losses and grow the revenue base.
NRR is often called a growth metric because it captures both retention quality and expansion efficiency in a single number.
Gross vs net revenue retention: key differences
The core difference in gross vs net revenue retention is simple. GRR measures retained revenue after losses, while NRR measures retained revenue after losses and expansion.
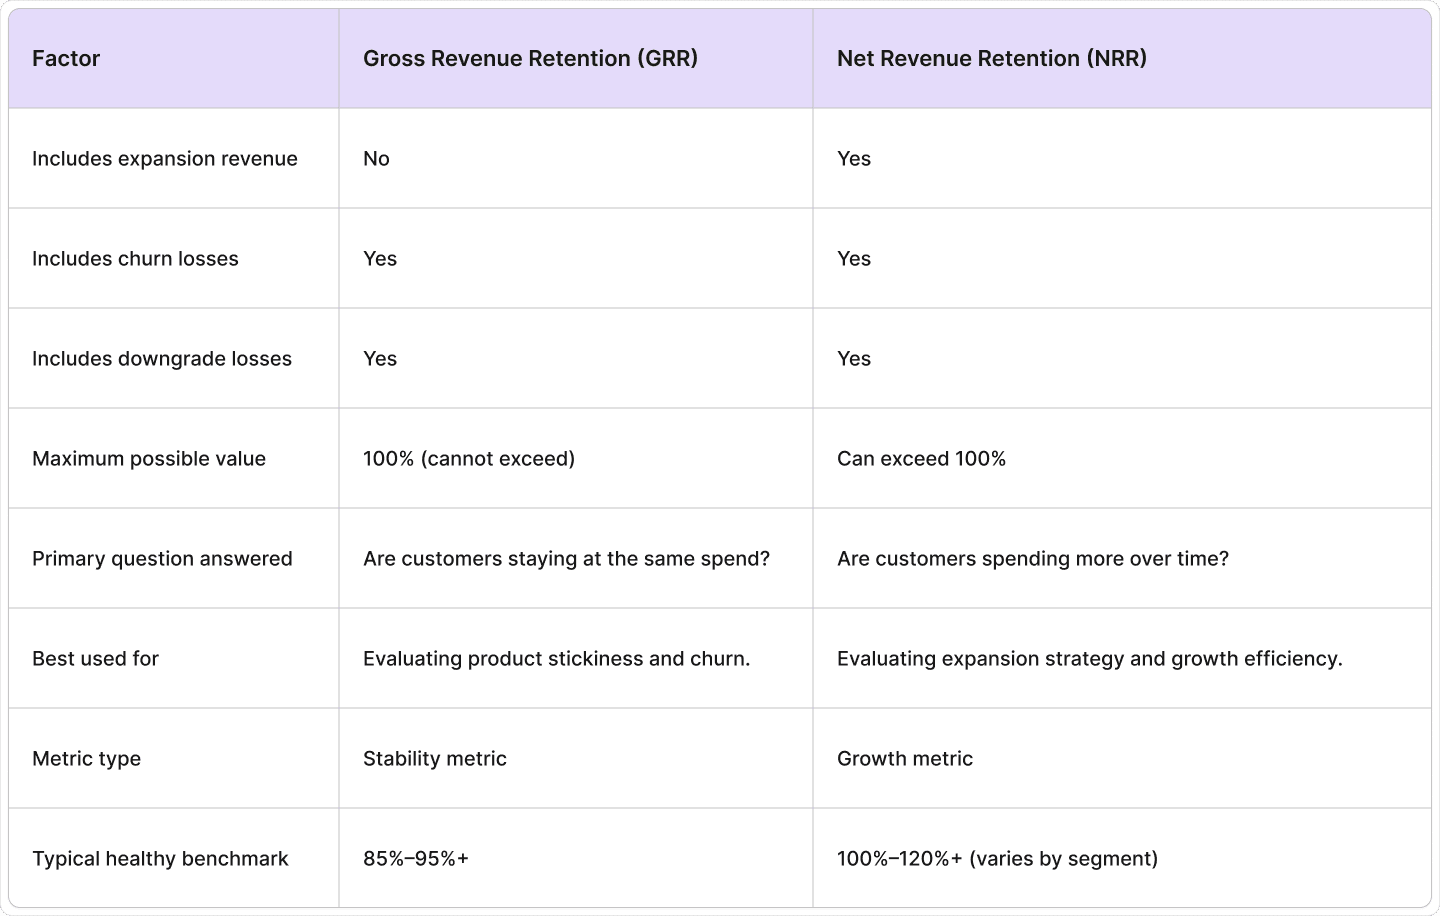
GRR answers a stability question. NRR answers a growth question.
How to calculate net revenue retention
NRR Formula:
NRR = (Starting ARR + Expansion − Churn − Downgrades) ÷ Starting ARR × 100
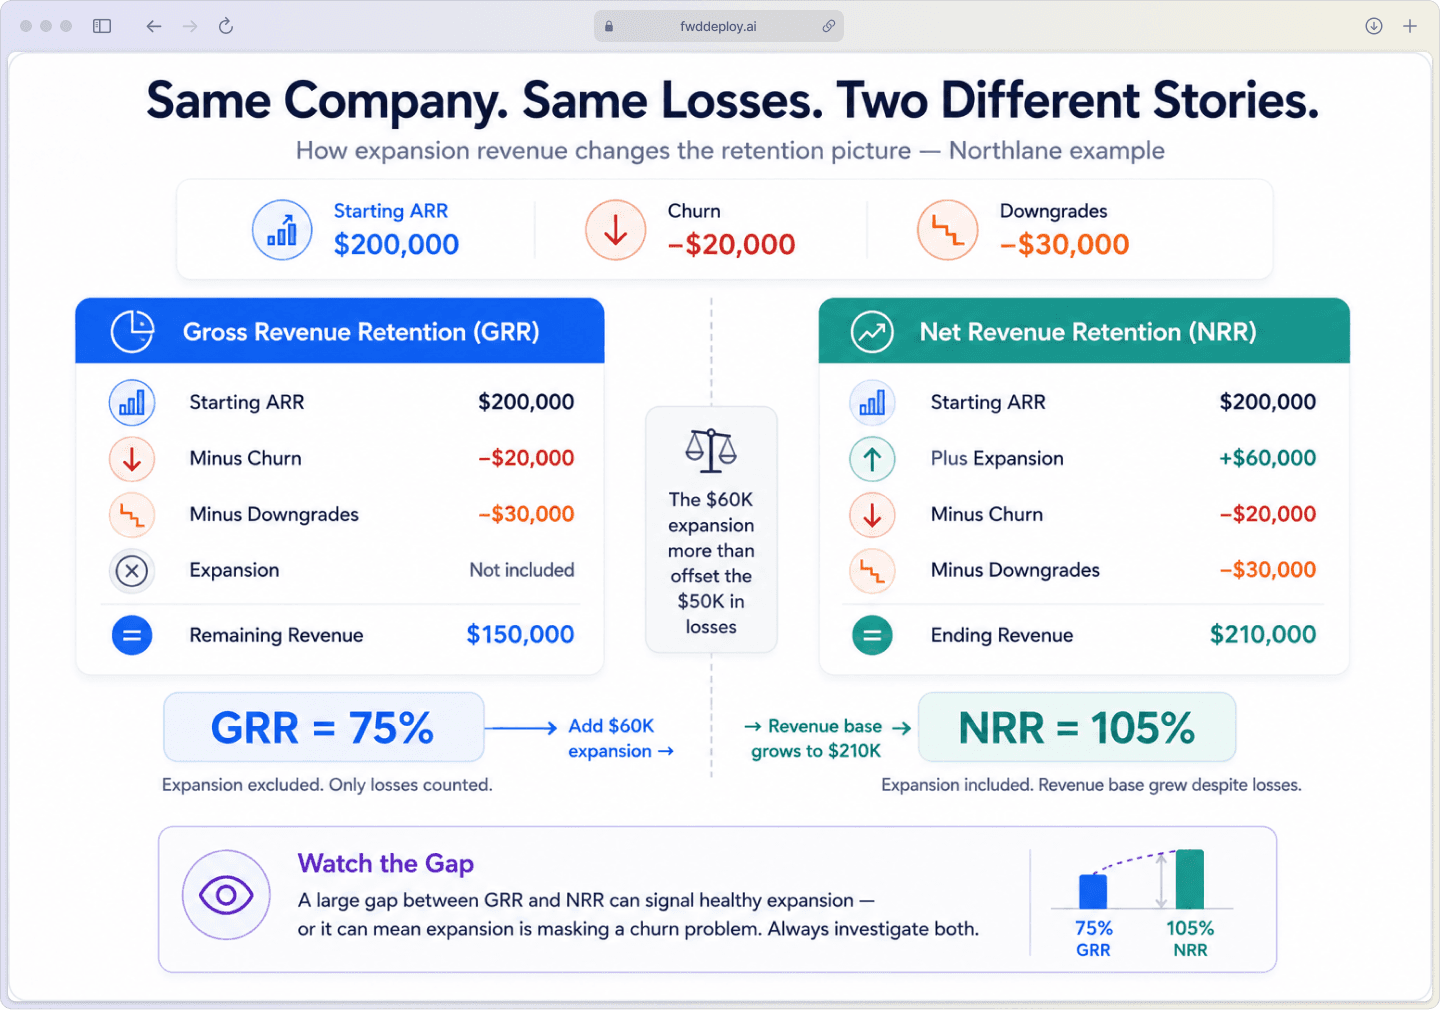
Using the same Northlane example: $200,000 starting ARR, $20,000 churn, $30,000 downgrades, add one more number. Northlane also generated $60,000 in expansion ARR from existing customers who upgraded their plans.
NRR = ($200,000 + $60,000 − $20,000 − $30,000) ÷ $200,000 × 100 = $210,000 ÷ $200,000 × 100 = 105%
Same company. Same losses. Different story.
Northlane's GRR sits at 75% because expansion is excluded. Its NRR lands at 105% because the $60,000 in upgrades more than offset the $50,000 in losses.
That gap between GRR and NRR is worth paying attention to. A large gap can mean expansion is healthy, or it can mean expansion is quietly covering a churn problem that deserves its own fix.
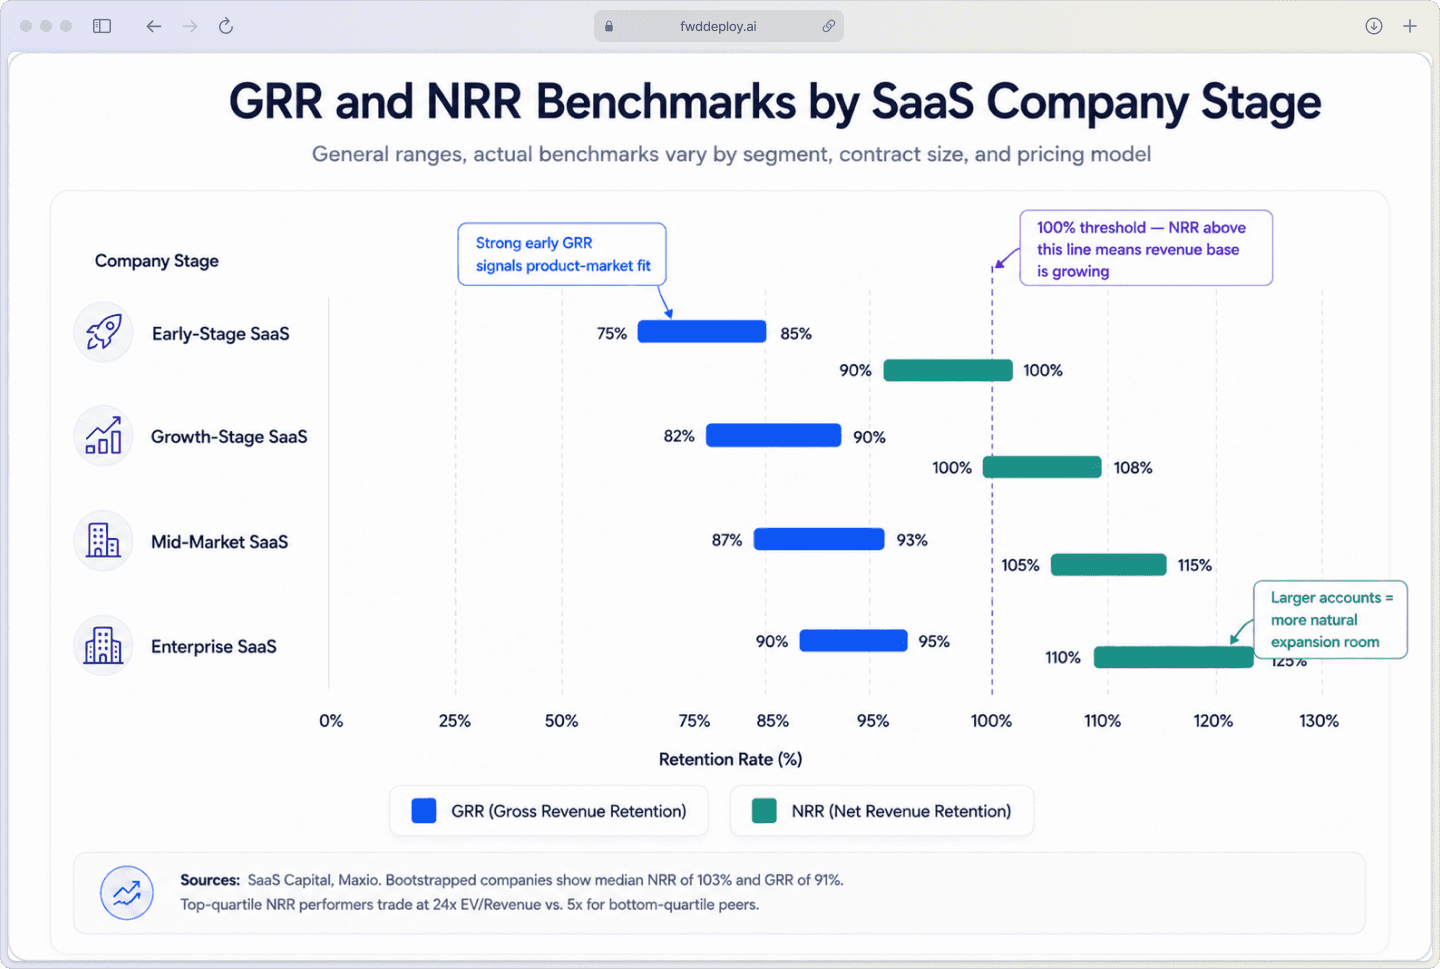
GRR and NRR benchmarks for SaaS
Benchmarks shift based on company stage, customer segment, contract size, and pricing model. There is no single universal number, but the general shape of healthy retention looks consistent across most SaaS businesses.
NRR benchmarks by company stage
Earlier-stage companies often post lower NRR because expansion motions, account management, upsell playbooks, and pricing tiers are still being built. As companies mature, NRR tends to rise as those systems become more structured. Bootstrapped companies show a median NRR of 103% and a GRR of 91%.
Enterprise SaaS typically sees stronger NRR than SMB-focused products. Larger customers buy more seats, add modules, and expand contracts over time, which creates more natural room for expansion inside existing accounts.
SMB products can still produce healthy NRR, but the path looks different. Smaller contract sizes and shorter buying cycles limit how much individual accounts can grow.
GRR benchmarks by company stage
GRR expectations stay high across most SaaS stages because it measures pure revenue durability, with investors expecting 85 to 95 percent GRR.
Large GRR losses, regardless of stage, usually point to a deeper issue in onboarding, product fit, pricing, support, or customer targeting.
For earlier-stage companies, strong GRR often signals that the product solves a real problem for the right customer group. For mature SaaS companies, consistent GRR across cohorts shows that the revenue base is stable even as the business scales.
If GRR is declining while NRR looks strong, that is worth investigating. Expansion revenue can mathematically offset churn, but it does not fix the underlying reason customers are leaving or downgrading.
When to prioritize gross retention over net retention
Both metrics belong in the same reporting set, but the emphasis shifts depending on role and stage.
For early-stage SaaS founders
GRR often carries more weight early on. It shows whether customers are keeping their subscriptions without reducing spend, which is the clearest early signal of product-market fit.
If recurring revenue keeps shrinking inside the existing base, expansion revenue can mask that problem for a while, but it does not solve it. Use our CS ops assessment to evaluate your retention foundation.
For customer success and RevOps leaders
For Customer Success teams, GRR reflects onboarding quality, adoption health, and renewal performance. For RevOps and account management, NRR shows whether expansion playbooks, upgrades, added seats, and bundled products are actually moving recurring revenue up. See how our customer success services support these goals.
Used together, the two metrics separate retention work from expansion work clearly.
For CFOs and finance teams
GRR helps estimate how much recurring revenue is likely to stay in place before any expansion is modeled. NRR adds the second layer, showing whether existing customers are likely to generate more revenue over the next period.
In valuation conversations, GRR signals revenue durability, and NRR signals growth efficiency from the existing base. Review our implementation ops assessment to align your reporting systems.
Why investors and boards track both NRR and GRR
Investors use GRR to assess revenue risk and product health. A strong GRR suggests customers keep paying because the product continues to deliver value. A weak GRR raises questions about fit, support, onboarding, or pricing, regardless of how strong the top-line growth looks.
NRR helps investors assess growth quality. When existing customers expand over time, a company can grow recurring revenue from existing accounts.
This changes the capital efficiency evaluation. Top-quartile NRR performers trade at 24x EV/Revenue versus 5x for bottom-quartile peers.
Two patterns that tend to get scrutinized:
Strong GRR, weak NRR: Stable product with limited expansion, signal of untapped opportunity
Weak GRR, strong NRR: Expansion is outpacing churn on paper, but that pattern can be unsustainable if the revenue base keeps weakening underneath
For boards, GRR and NRR work better as a pair. One explains the floor; the other explains the trajectory.
How to improve gross and net revenue retention
Improving retention comes from changes in daily operations across customer success, product, sales, and the systems connecting them.
1. Reduce churn with proactive customer success
Proactive customer success focuses on account health before renewal risk becomes visible. This often includes onboarding check-ins, adoption reviews, and outreach when product activity drops. Our support ops assessment can help identify gaps in your customer health process.
Health scoring helps teams organize risk consistently by combining product usage, support history, renewal timing, and survey feedback into one view.
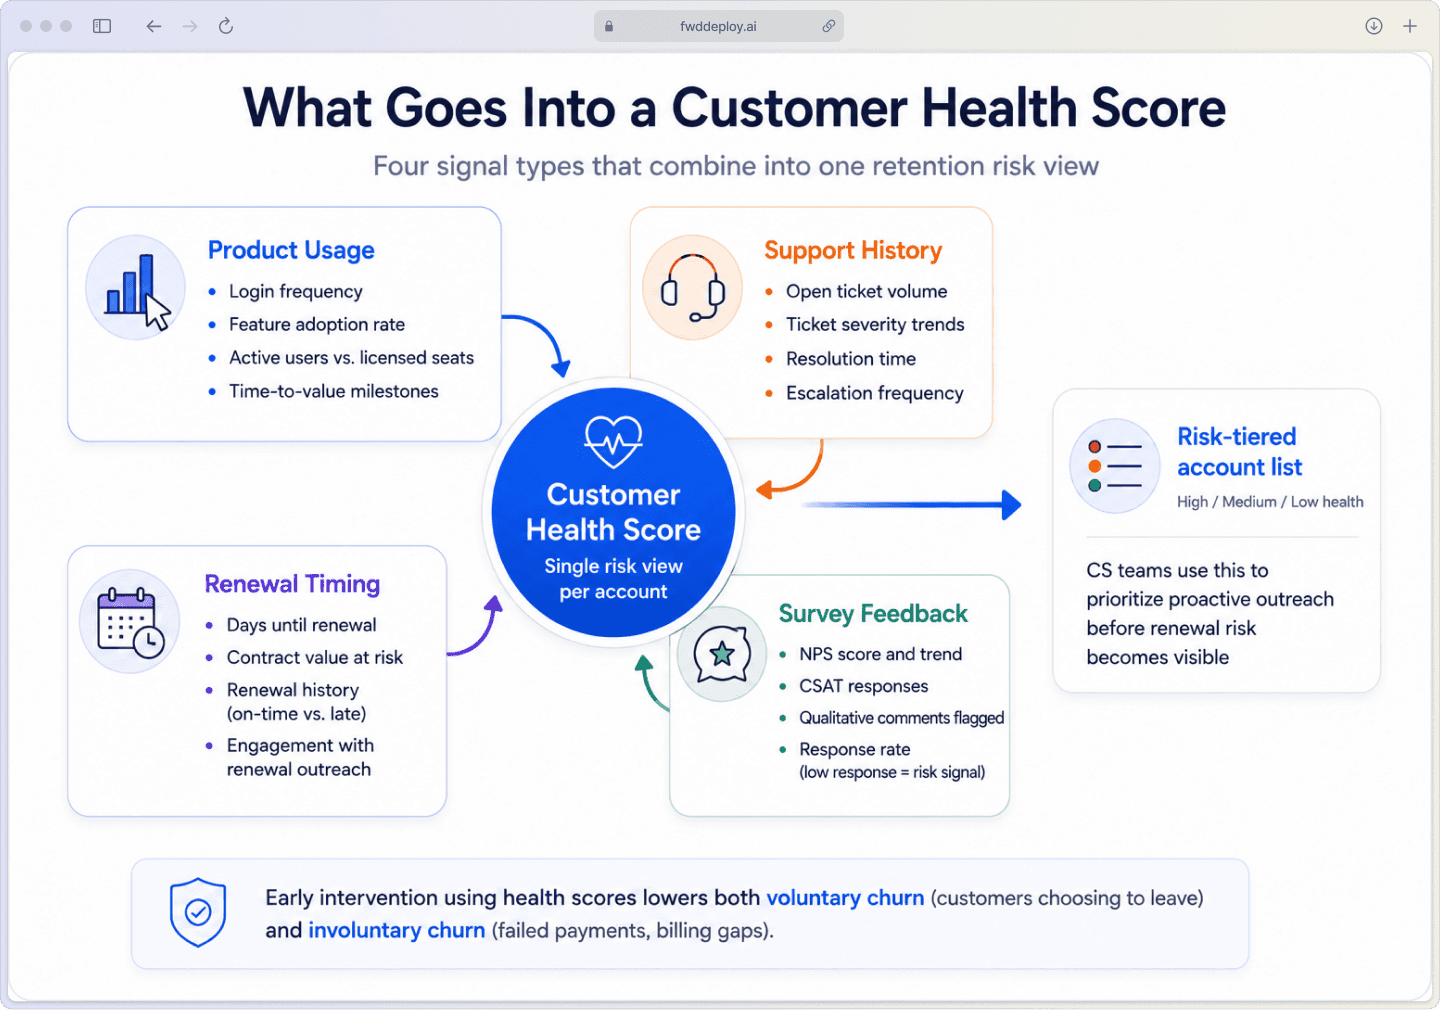
Early intervention lowers both voluntary churn (customers choosing to leave) and involuntary churn (failed payments, billing gaps).
Platforms like Freshworks centralize customer signals. Teams can spot warning signs earlier and respond with proper context at scale.
2. Drive expansion through upsells and cross-sells
Expansion usually starts with evidence that a customer is ready for more value:
High product usage or adoption across multiple departments.
Team growth that creates demand for additional seats.
Repeated requests for advanced features or integrations.
Upsell means moving a customer to a higher plan or larger contract. Cross-sell means adding a complementary product or service. Both work best when account data reflects actual customer behavior, without usage visibility, expansion efforts become guesswork instead of account planning.
3. Segment customers by lifetime value
Customer Lifetime Value (LTV) estimates how much recurring revenue a customer may generate over the full relationship. Segmenting by LTV helps teams direct retention efforts toward high-value accounts while managing lower-value segments through scaled programs and automation.
Segmentation surfaces risk patterns earlier. If one segment shows more downgrades or shorter lifecycles, that pattern becomes easier to investigate before it shows up as a GRR problem. Take our CS ops assessment to see how your segmentation stacks up.
4. Build a single source of truth for retention data
Retention analysis becomes unreliable when data lives in separate tools with different definitions. Billing systems, CRM records, support platforms, and product analytics often tell slightly different versions of the same account story.
A single reporting structure helps finance, customer success, sales, and leadership work from the same numbers. This makes both GRR and NRR easier to calculate accurately and trust.
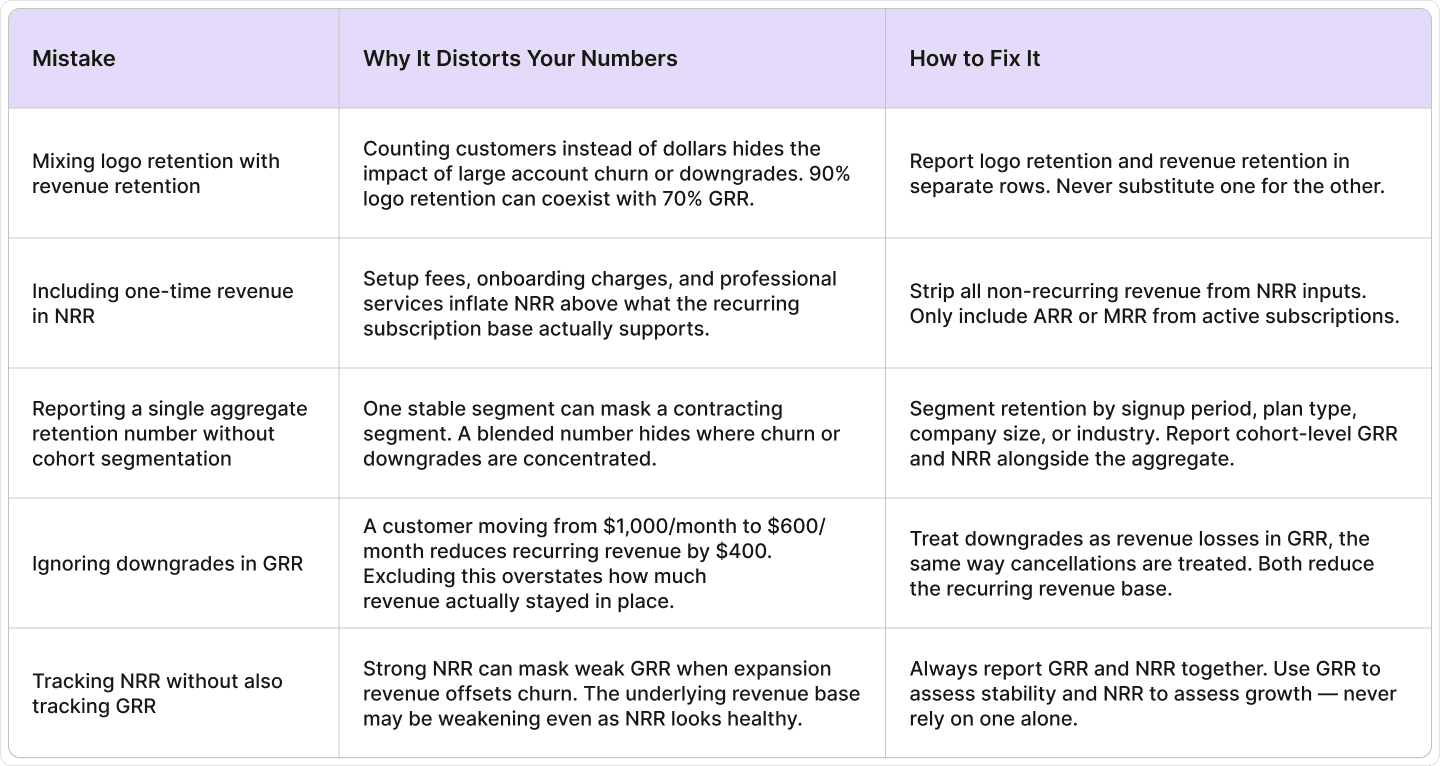
Common mistakes SaaS leaders make when tracking retention
Small definition errors in retention reporting can change the final number significantly.
Small definition errors in retention reporting can change the final number significantly.
Mixing up logo retention and revenue retention
Logo retention counts customers. Revenue retention counts recurring dollars. A company can keep 90% of its customers and still post weak GRR if its largest accounts cancel or downgrade.
The two metrics tell different stories and belong in separate reports.
Including one-time revenue in NRR
NRR tracks recurring revenue only. Setup fees, onboarding charges, training packages, and professional services do not belong in the calculation. Including them makes retention look stronger than the subscription base actually is.
Reporting without cohort segmentation
A single aggregate retention number can hide significant differences between customer groups. One segment may be stable while another is contracting.
Cohort segmentation groups customers by signup period, plan type, company size, or industry. This makes it easier to see where churn or downgrades are concentrated.
Ignoring downgrades in GRR
Downgrades are revenue losses just like cancellations. A customer who moves from a $1,000/month plan to a $600/month plan has reduced recurring revenue by $400, and that reduction belongs in GRR. Leaving downgrades out of the calculation overstates how much revenue actually stayed in place.
Turn retention insights into action with fwdDeploy
Understanding GRR and NRR is one thing. Building the systems that improve them is another.
fwdDeploy helps SaaS teams turn retention data into operational improvements. We work across customer success, implementation, and support operations to close the gaps that hurt retention numbers.
Our approach starts with assessment. We evaluate your current retention infrastructure, identify where revenue is leaking, and map the specific changes that will move GRR and NRR in the right direction.
Then we build the systems that make those changes stick: health scoring models, expansion playbooks, segmentation frameworks, and the reporting structure that keeps everyone working from the same retention data.
Book a free strategy call to see where your retention operations stand and what to fix first.

Ready to fix your sales-to-CS handoff?
Stop losing context between teams. fwdDeploy builds handoff processes that run inside your CRM and CS tools, not spreadsheets.
FAQs About AI personalization
What does NRR above 100% mean?
Is net revenue retention the same as net dollar retention?
How is revenue retention different from customer logo retention?
How often do SaaS companies typically report GRR and NRR?
Can NRR exceed 100% with low gross retention?
How do I calculate GRR and NRR quickly?
Five questions. Your work email. Under four minutes. We will tell you your maturity level, your highest-impact gap, and whether a conversation makes sense. No pitch. No demo request.
